Energy Safety Calculator
Enter your energy mix percentages (must sum to 100%):
Expected Fatality Rate
0.00 deaths per TWh
This is compared to the global average.
When you read headlines about climate talks or power‑plant accidents, the first question that pops up is often: least deadly energy source. The answer isn’t as simple as “renewables are always safer” - the devil is in the data, the methodology, and the context. This guide walks you through the latest global statistics, explains how death counts are calculated, and shows which technologies really sit at the bottom of the fatality ladder in 2025.
Understanding Energy Fatality Rates
Energy fatality rate is a measure of the number of deaths that occur for each terawatt‑hour (TWh) of electricity generated. It lets us compare apples to apples: a coal plant that feeds millions of homes can be compared fairly with a single wind turbine, even though their sizes differ dramatically. The most common unit is deaths per TWh, because it normalises raw death tallies against the amount of energy produced.
How Deaths Are Counted
Counting deaths isn’t just about tallying headlines. Researchers differentiate three categories:
- Direct occupational fatalities - workers killed on site, e.g., miners, turbine technicians.
- Indirect health impacts - long‑term diseases caused by air pollution or radiation exposure.
- Catastrophic accidents - rare events like dam failures or nuclear meltdowns.
International bodies such as the International Energy Agency (IEA) and the World Health Organization (WHO) publish consolidated figures that blend these categories. The methodology typically spreads the total number of fatalities over the cumulative electricity generated by a technology over its lifetime, giving a single, comparable fatality rate.
Global Data 2025: Comparing Sources
The table below summarises the most recent peer‑reviewed estimates for 2020‑2024. Numbers are rounded to two decimal places for readability.
| Energy Source | Deaths / TWh | Primary Fatality Category |
|---|---|---|
| Coal | 24.6 | Occupational & Air‑pollution related |
| Oil | 18.4 | Occupational & Pollution |
| Natural Gas | 2.8 | Occupational & Gas explosions |
| Nuclear power | 0.07 | Catastrophic accidents (rare) |
| Hydropower | 0.5 | Dam failures & construction accidents |
| Wind power | 0.04 | Construction & maintenance incidents |
| Solar power | 0.02 | Installation and rare fires |
| Geothermal | 0.03 | Drilling accidents, steam releases |
| Biomass | 0.9 | Fuel handling & air‑quality issues |
Even though nuclear power occasionally makes headlines for catastrophic events, its long‑term fatality rate per TWh is dramatically lower than coal or oil. Solar and wind sit at the very bottom of the list, recording fewer than one death per hundred terawatt‑hours.

Why Renewable Sources Score Low
Renewable energy is a category of power generation that relies on naturally replenished resources such as sunlight, wind, and water flow. Several factors drive its low fatality numbers:
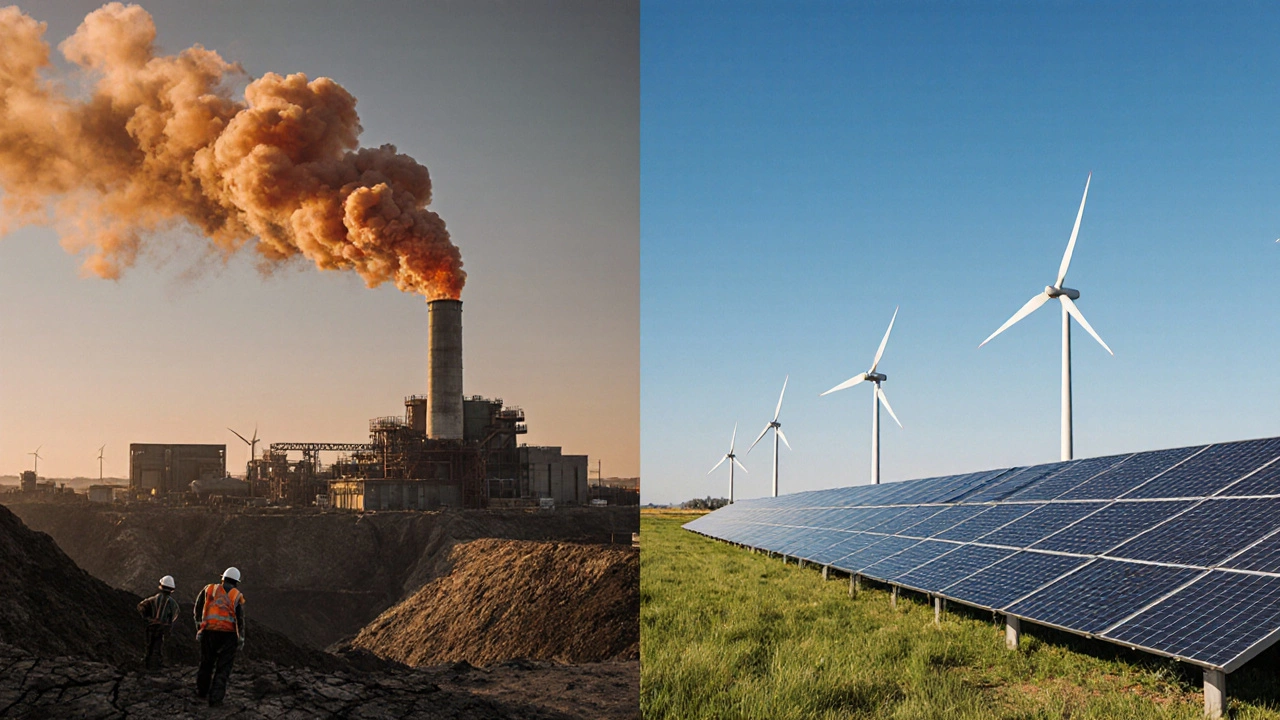
- No combustion - no coal dust, no carbon monoxide, no sulphur emissions that kill millions over decades.
- Modular design - wind turbines and solar panels are built in factory settings with rigorous safety standards, reducing on‑site risk.
- Shorter construction cycles - a solar farm can be installed in months, limiting exposure to construction‑related accidents.
- Predictable operating conditions - wind turbines have few moving parts once commissioned, lowering the chance of mechanical failures.
These benefits translate into fewer occupational hazards and virtually no long‑term health impacts for the surrounding population.
Misconceptions and Hidden Risks
Low fatality rates don’t mean zero risk. Some common myths worth debunking:
- Wind turbines cause many deaths - most reported incidents involve maintenance crews, not the public. The industry has stricter lock‑out/tag‑out protocols than coal mining.
- Solar farms emit harmful radiation - photovoltaic cells produce no ionising radiation; the main safety concern is electrical shock during installation.
- Hydropower dams are always safe - large dam failures are rare but can be catastrophic. Modern designs incorporate seismic sensors and emergency spillways to minimise risk.
- Nuclear waste is a death‑causing nightmare - while waste management is a long‑term responsibility, the direct mortality impact remains minuscule compared with fossil‑fuel air pollution.
Understanding these nuances helps policymakers weigh true trade‑offs rather than relying on sensational headlines.
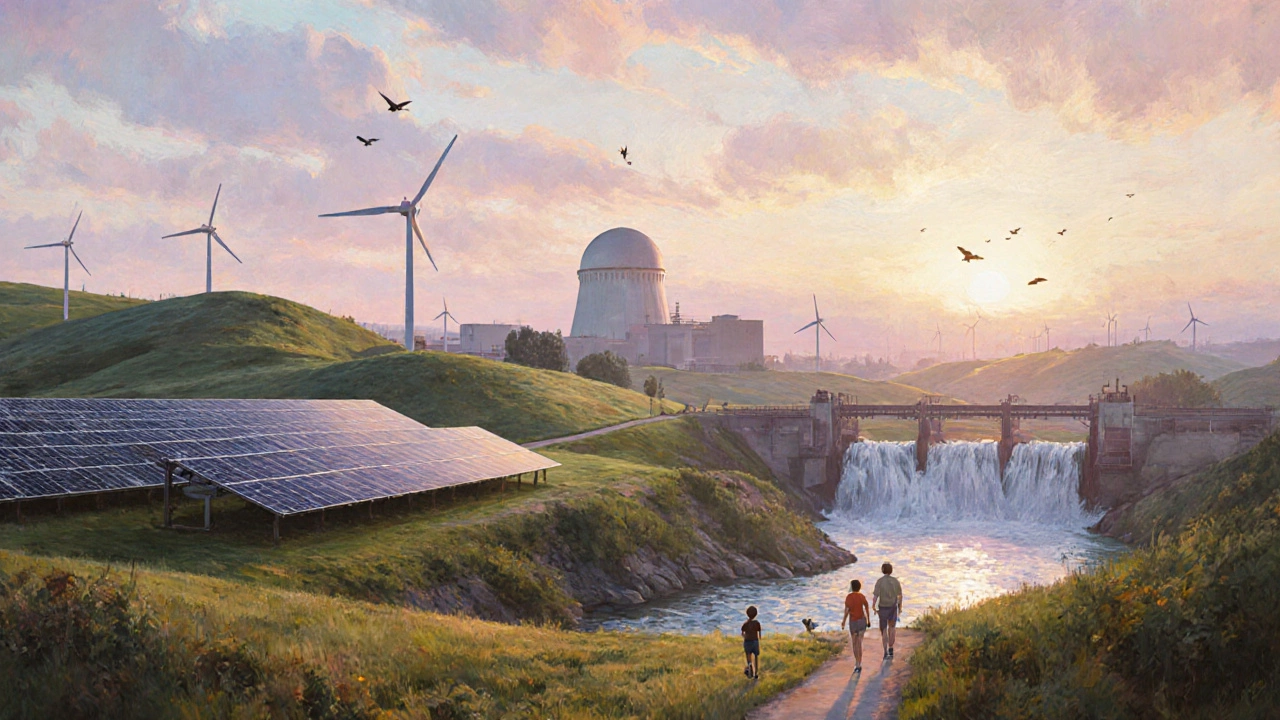
Choosing the Safest Energy Mix
If your goal is to minimise deaths per unit of electricity, the data points to a mix heavily weighted toward solar, wind, and hydro, complemented by a modest share of nuclear for baseload stability. Here’s a quick decision‑tree you can use:
- Do you need > 80 % of power on‑demand? → Consider adding nuclear or natural‑gas peaker plants (still far safer than coal).
- Is land availability limited? → Prioritise offshore wind and rooftop solar, which have tiny fatality footprints.
- Is water scarcity a concern? → Avoid large‑scale hydropower in arid regions; choose run‑of‑river schemes with lower dam heights.
Remember, the safest mix is also the most climate‑friendly, because the bulk of premature deaths from fossil fuels stems from air‑pollution‑related diseases.
Quick Safety Checklist for Energy Projects
- Verify that occupational health & safety (OHS) certifications are up‑to‑date for all workers.
- Require independent third‑party audits of emission‑control systems for any remaining fossil‑fuel units.
- Ensure emergency response plans are tested annually for dams, nuclear sites, and large solar farms.
- Adopt real‑time air‑quality monitoring around coal‑ or oil‑fired plants to quantify indirect health impacts.
- Include community‑engagement clauses in contracts to address concerns about visual impact, noise, or land use.
Frequently Asked Questions
Which energy source has the lowest death rate per TWh?
Solar photovoltaic systems record the lowest fatality rate-about 0.02 deaths per terawatt‑hour-followed closely by on‑shore wind at 0.04 deaths per TWh.
Why does nuclear power have such a low fatality rate despite high‑profile accidents?
The fatality figure spreads the rare, severe incidents (e.g., Chernobyl, Fukushima) over the huge amount of electricity produced over decades. When normalised, the deaths per TWh are far lower than those from coal‑related air pollution, which kills hundreds of thousands annually.
Do renewable projects cause indirect deaths through land‑use changes?
Indirect health impacts from renewables are minimal. Most concerns are ecological (habitat loss) rather than human fatalities. Proper site selection and environmental impact assessments keep any health‑related risk near zero.
How reliable are the death‑per‑TWh numbers?
Researchers use peer‑reviewed life‑cycle assessments, combining occupational data, epidemiological studies, and historical accident reports. While exact numbers can vary by country, the relative ranking of technologies remains consistent across major studies.
Can combining multiple renewables lower overall death risk even further?
Yes. A diversified renewable portfolio spreads construction and maintenance activities across different sites and skill sets, reducing the concentration of occupational hazards. Adding a modest share of nuclear for baseload can also keep overall deaths low while ensuring reliability.